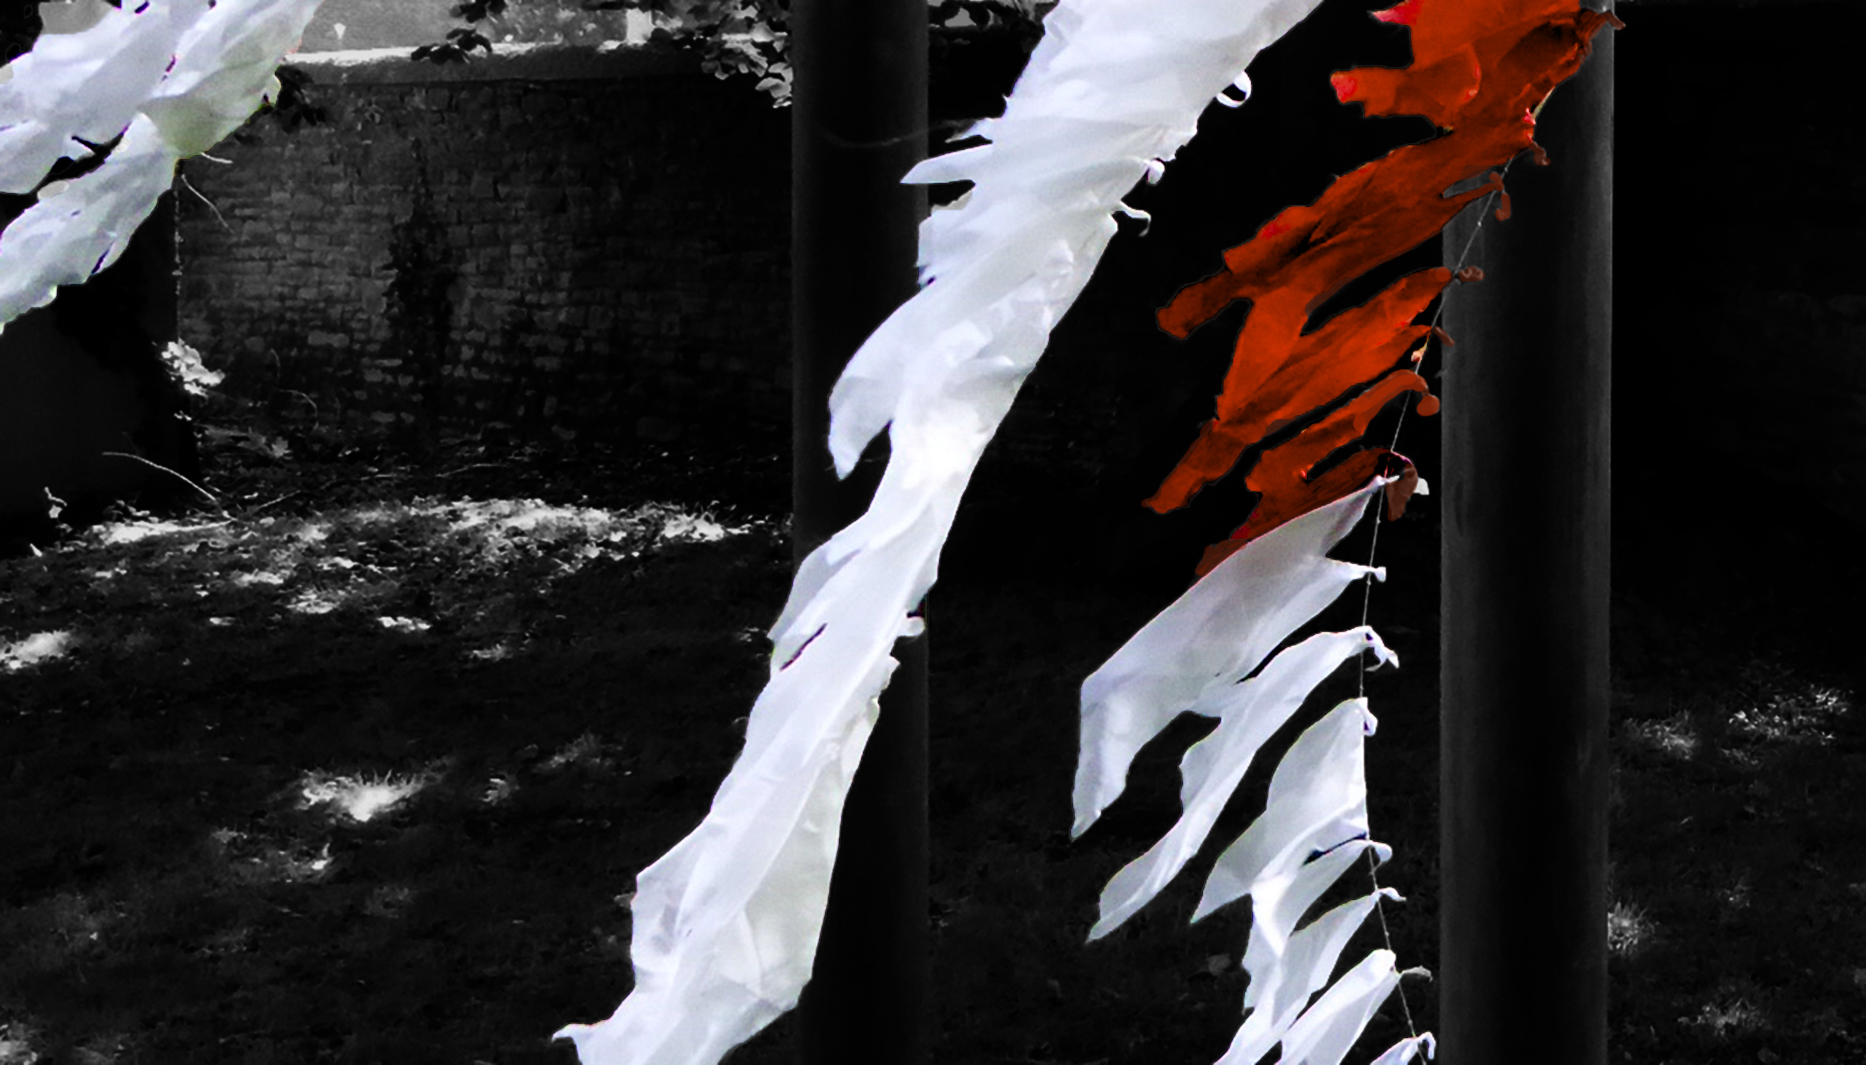
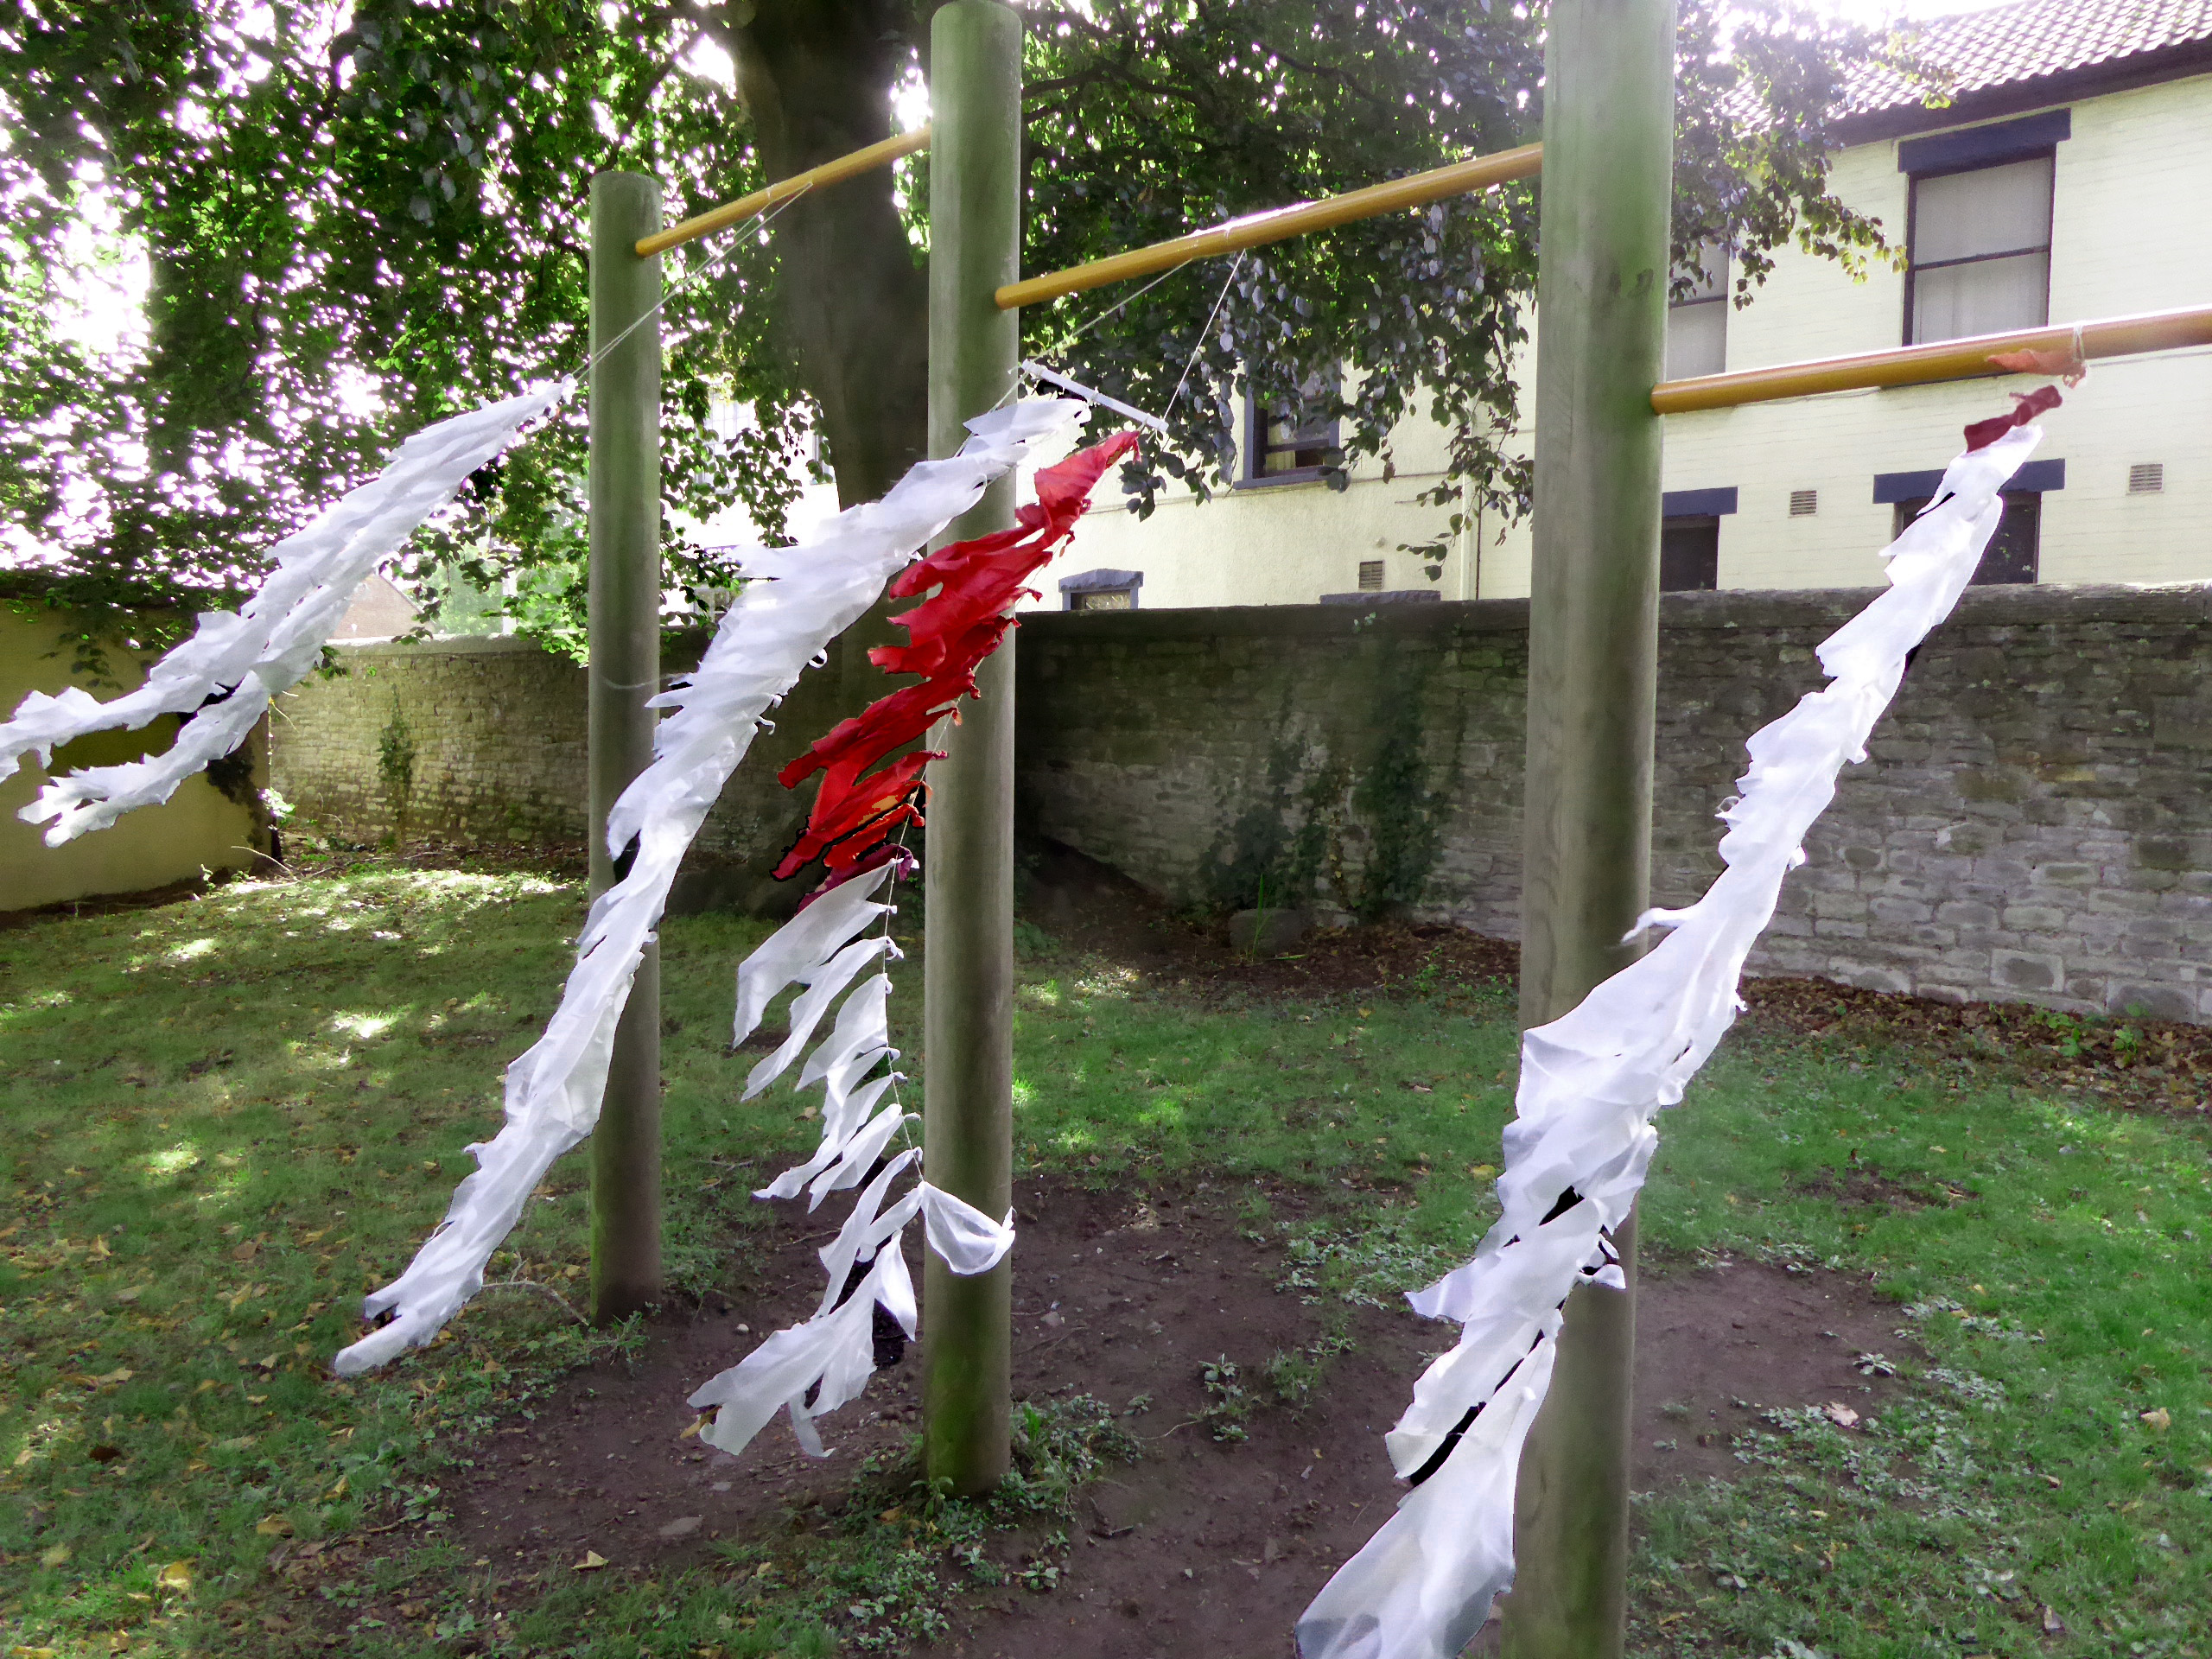
The silk rags are a graph to show women admitted to the asylum over the same period, 1861 – 1900, each one represents ten women.
Women admitted are separated into single married and widowed, from left to right in the photo. The red rags show women for whom childbirth or specifically female related problems were indicated as a contributing factor to their admissions. The graph shows about 1000 each single and married women and somewhat over 300 widows. The widows have very few female problems, perhaps due to being mostly older. The single women also have very few of such problems and married women many more, as can be seen form the photo. One might expect that ‘hysteria’ would be a common reason for admitting women to the asylum, but there are only about five mentions of the word, of which four relate to single women.
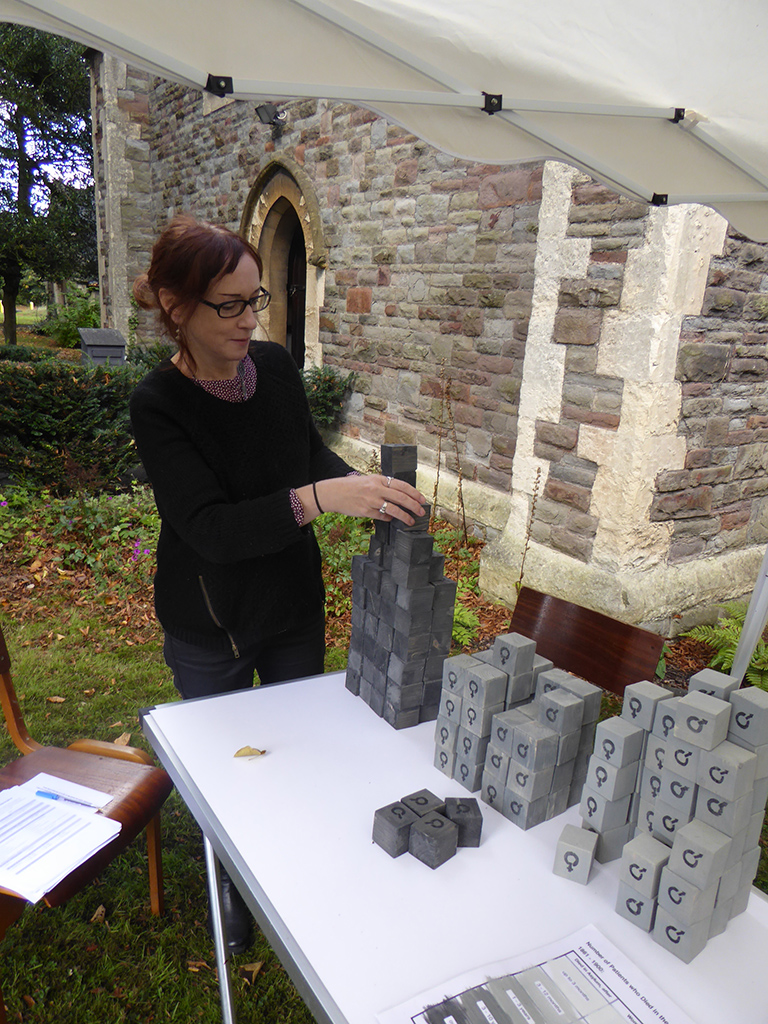
The blocks are a three dimensional graph, an attempt to bring thoughts about the patients into the museum. The legalities of confidentiality are such that only data over 100 years old can be looked at without permission of the patient or their family. So the central reason for the existence of the asylum is little in evidence in the museum.
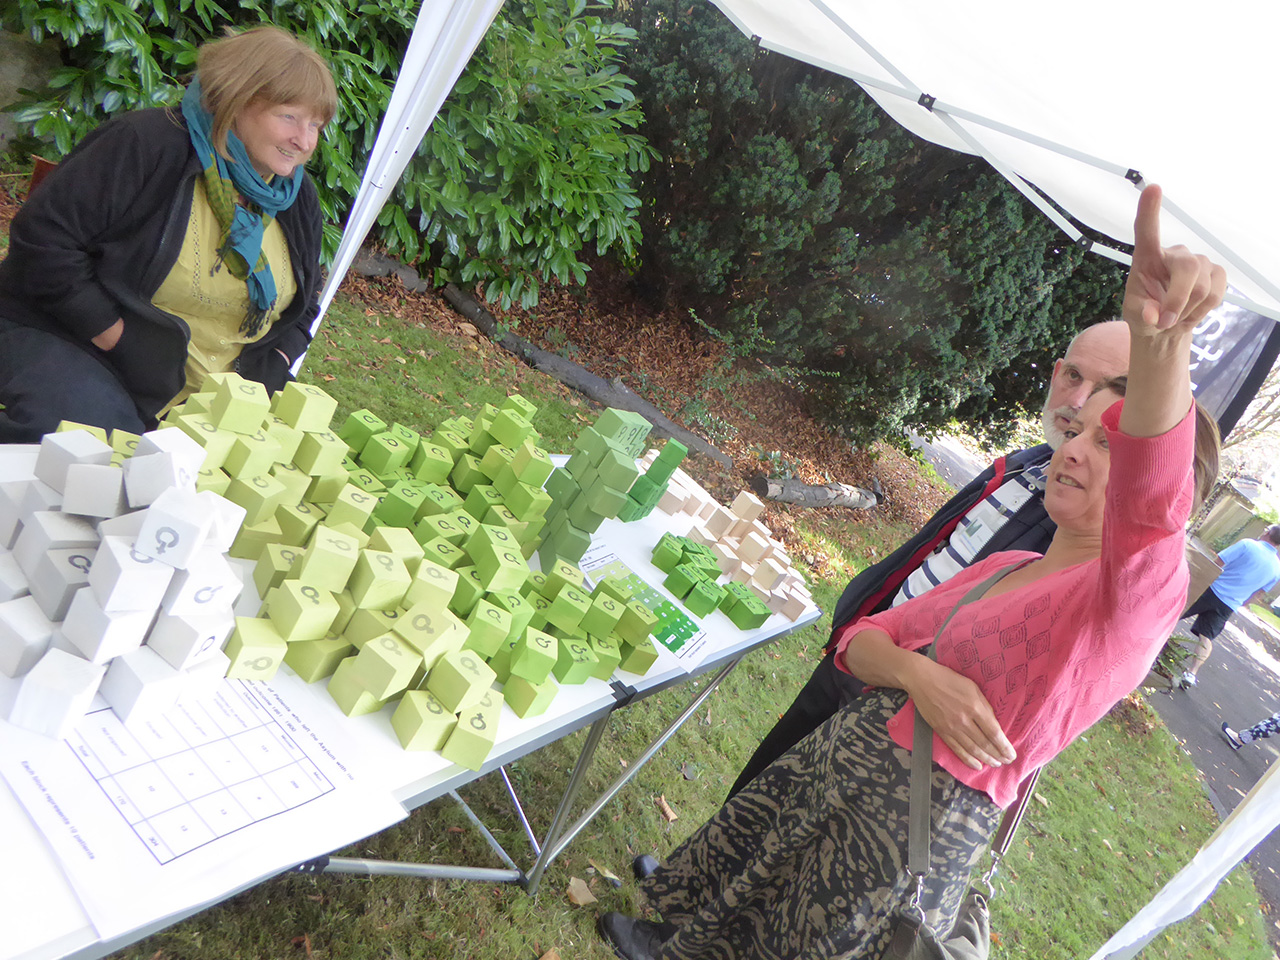
Their aim is to start discussions about the outcomes for patients admitted to the asylum in C19th through the numbers represented in the graph. The blocks were shown at Glenside Hospital Museum’s Bristol Doors Open 11 October, 2016. A large gazebo was set up for alldaybreakfast by the front door on this beautiful autumn day.
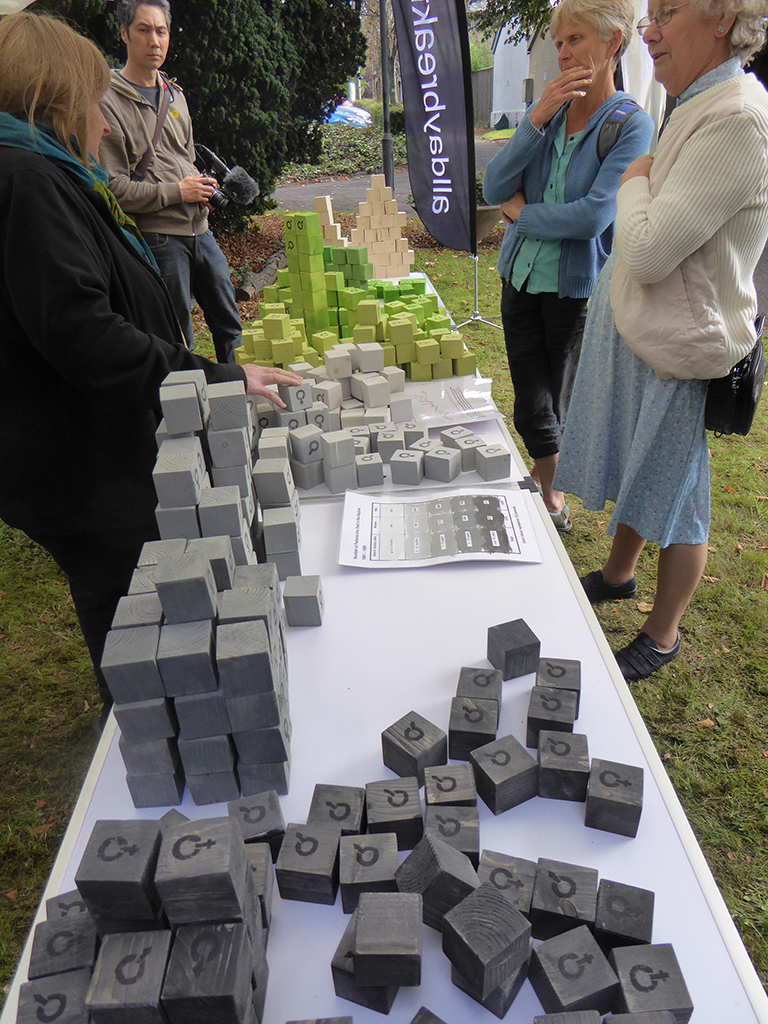
Each block represents ten men or women and is labeled by gender and coloured, green for patients who left on their own feet, ‘restored’ or ‘relieved’, grey for those who died in the asylum. The darker the colour the longer the person was in the asylum. The unpainted blocks at the far end of the table represent people who did not have a clear outcome; they were transferred to other institutions or no outcome is recorded, or they escaped! Thirteen men and one woman are given as ‘escaped’ during the 38 years covered in my study.
Just looking down the table it is clear that the largest cohort is that of people who left between three months and a year of admission, beyond a year’s stay the numbers fall off quite sharply. Of those who died many did so in the first year. Most of those who stayed in the asylum for over ten years died there.
Looking down the table; from death to life
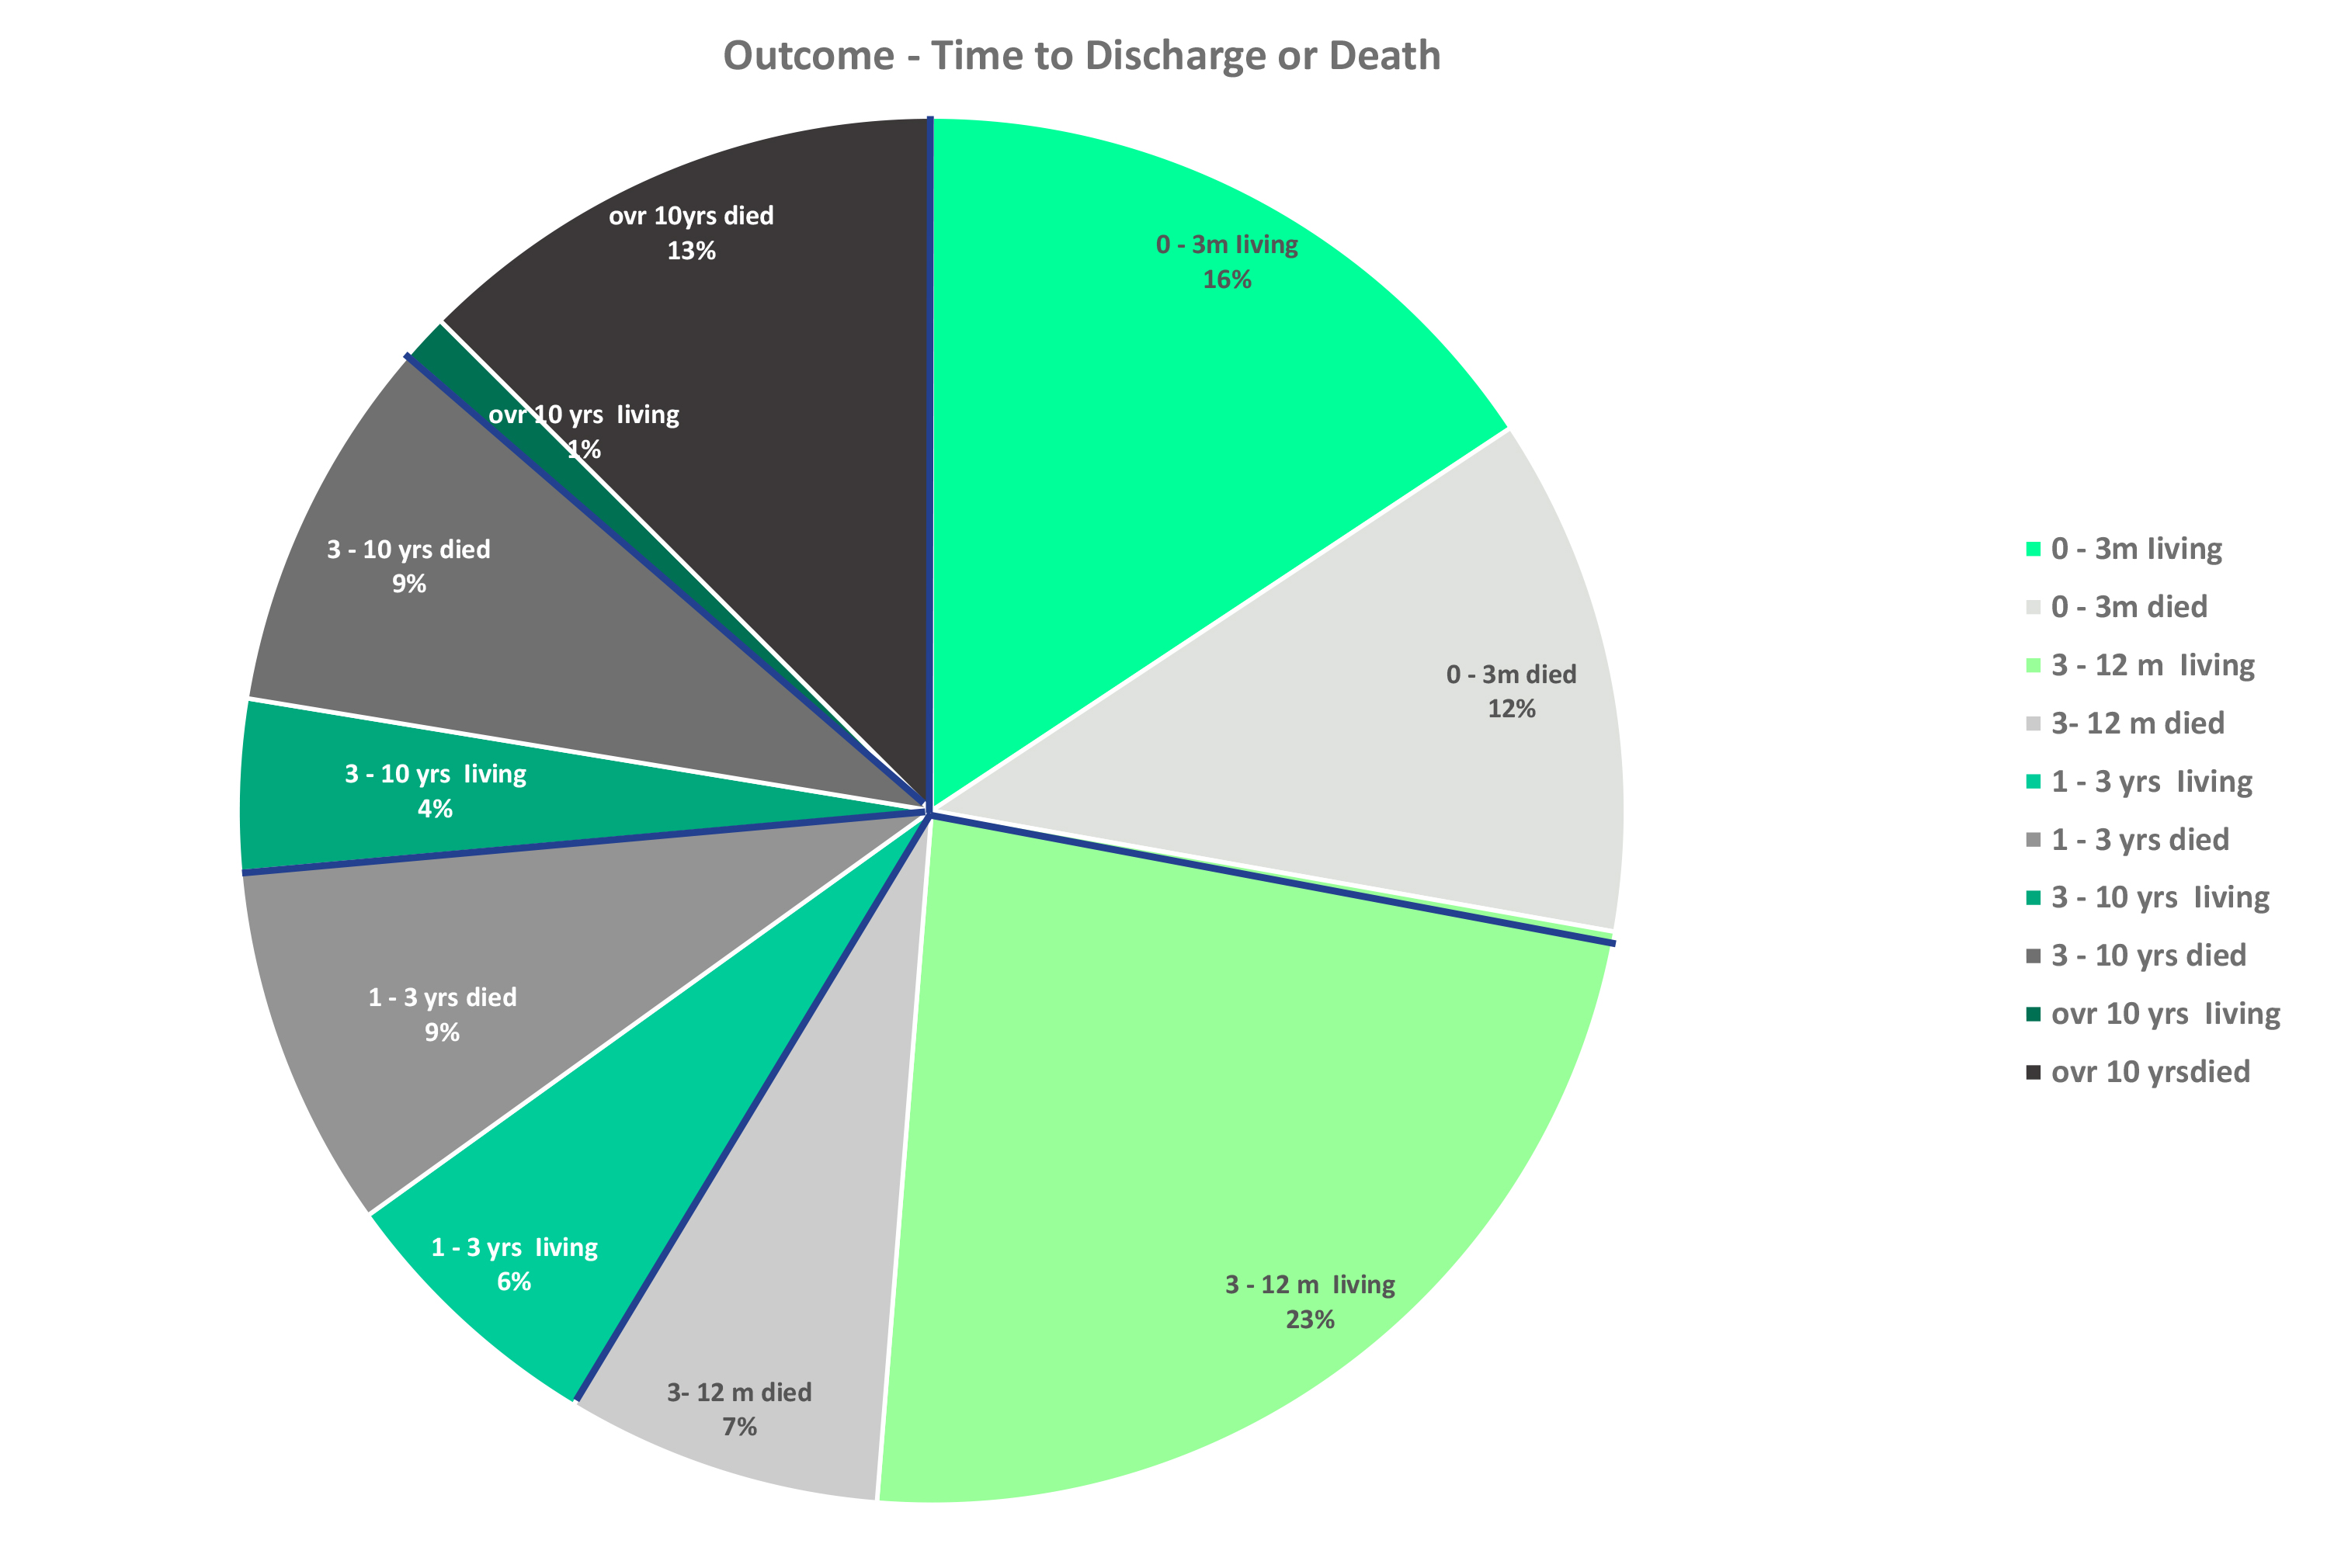
The blocks show that within the first year of being admitted, over half the patients left, but a significant proportion of those people left ‘feet first’. Just under half of the admissions were in for longer than a year. About 70% of people who left alive, left within a year, and about half of the people who died in the asylum died within their first year.
Overall during this time there were slightly fewer women than men admitted but men were more likely to die (perhaps they were more unwell on admission) and were more frequently diagnosed as suffering from ‘General Paralysis of the Insane’. Now know to be tertiary syphilis and fatal within about three years
Outcome for People admitted to Bristol Asylum 1861 – 1900
Looking at my graphs and numbers I wanted to think how the humanity of the patients could be made more easily appreciated. Graphs are always a bit flat, and don’t convey so much if one is not used to thinking in those sorts of terms. But on the other hand how can one think about desperate people in such huge numbers. There are about 700 patient photographs all from the 1890s and looking through them is such a moving experience. Here are people who are just people who have somehow got to the point of needing serious help with getting on with their lives. We have no images of people admitted before about 1894.
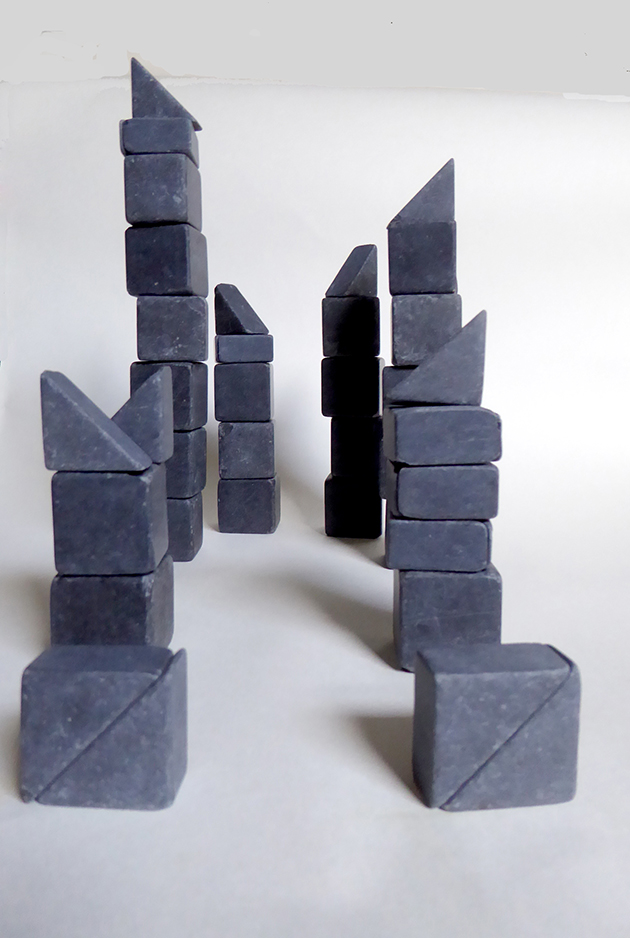
I started thinking about bringing the graphs into the real world, tried piling up some lovely antique slate blocks I have (they had to be confiscated from actual children as they started throwing them round the room).
A graph made of Slate.
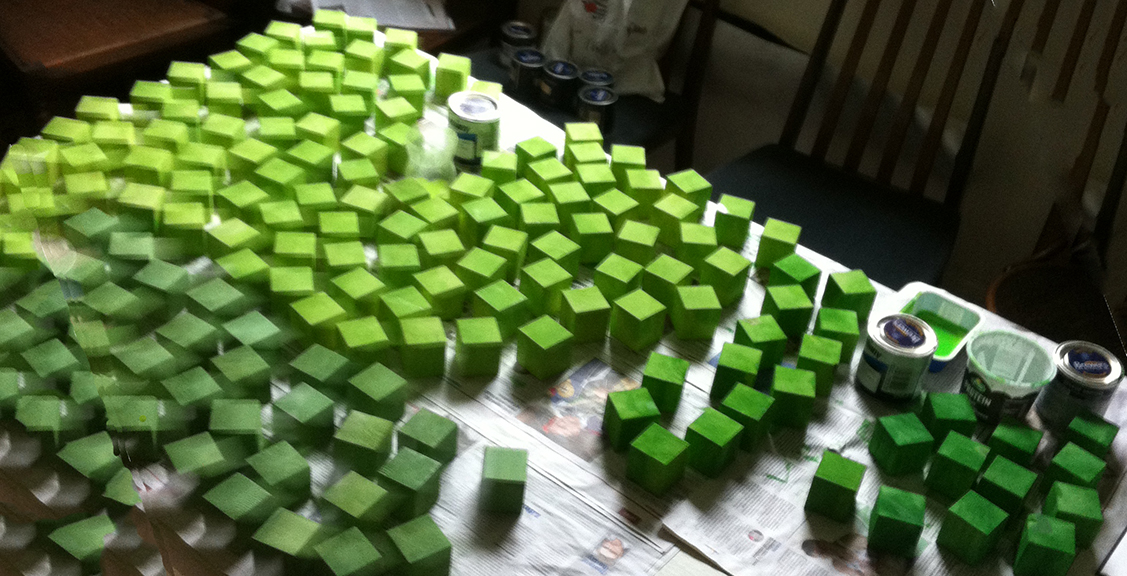
Then it occurred to me that if the blocks were coded somehow they would embody the graph and however they were arranged they would express what the graph was showing. So on to painted wooden blocks, with each block representing ten patients.
The start of making a three dimensional graph of patients’ stay in the hospital.
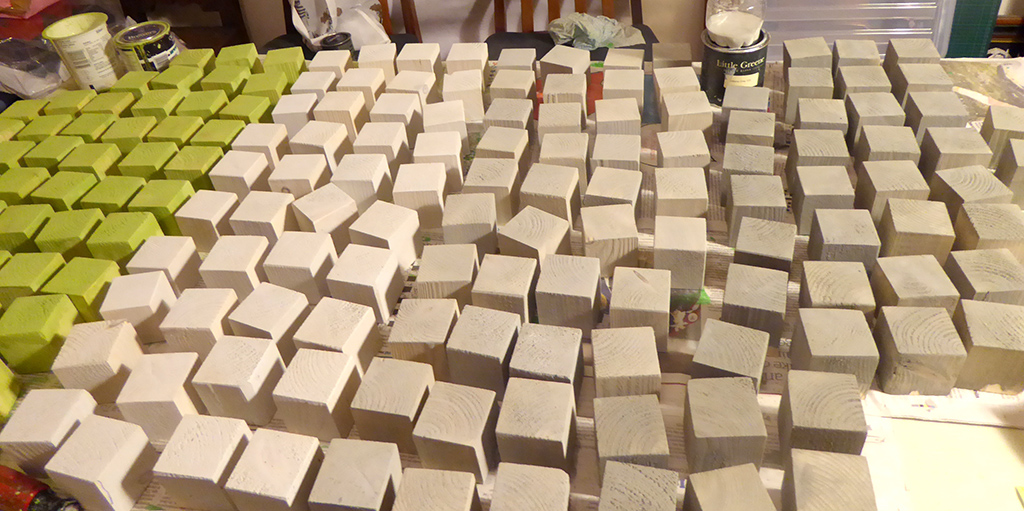
Green seemed like a nice, living colour so green is for patients who left, statedly recovered or relieved (their condition was improved), on their own two feet. The darker the colour the longer the stay. The blocks in the lower right corner are patients who left after more than ten years. A few people left who’s condition was said to be unchanged, others were transferred to another asylum, a few left with no outcome recorded and about eleven people (one woman and ten men) escaped at different times, these people are represented by plain, unpainted blocks. About half of the people admitted died in the asylum, these are represented by grey blocks which get darker for longer spent in the asylum, black for over ten years.
Green and Grey Blocks.
This photo shows people who were in the asylum for three months or less and people who died in the asylum within three months, within a year and within three years – three tones of grey.
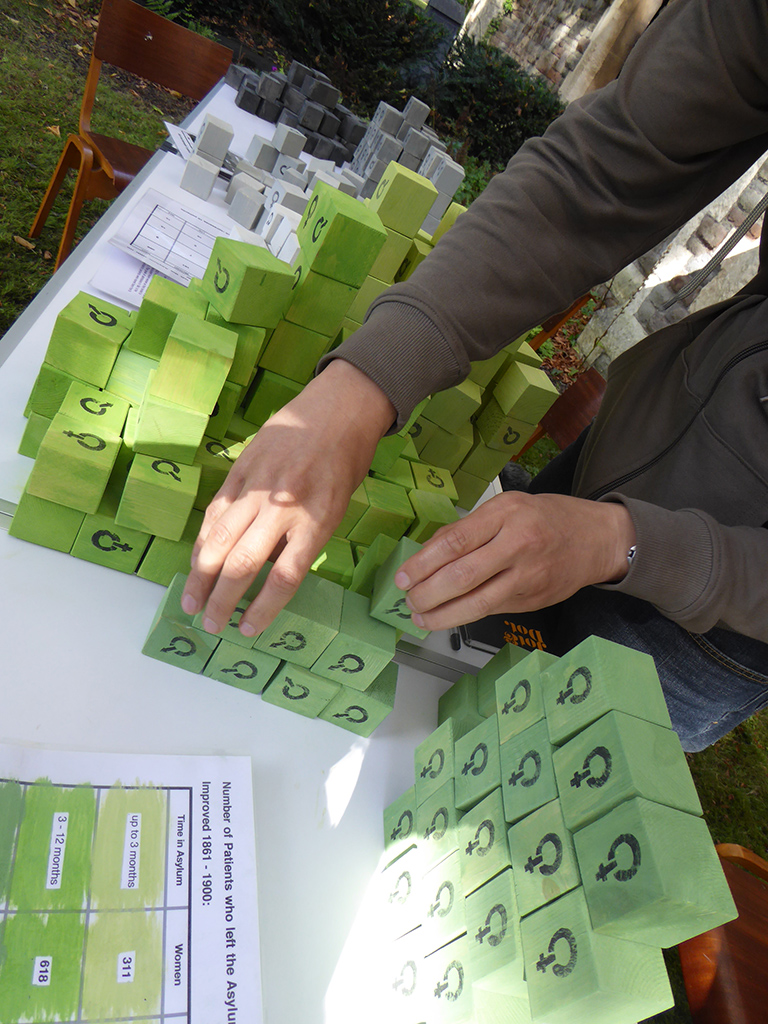
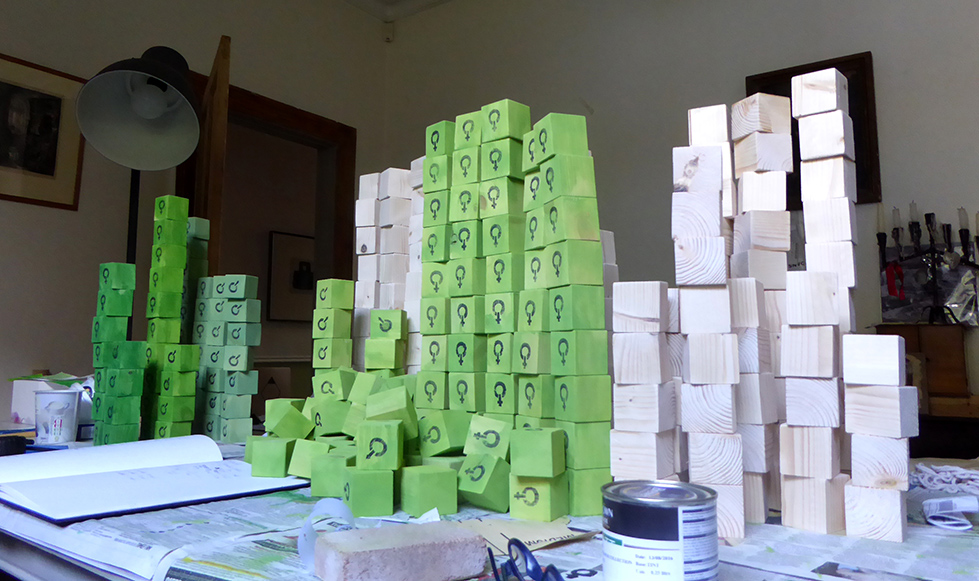
The blocks show that about 70% of people who walked out did so within a year. Outcomes for men and women were different so I have marked the blocks with a gender.
Green Blocks marked by Gender.
The blocks in the background are unpainted. The painted ones have been stencilled with a gender. There seem to be a lot of women, but the men have fallen over!
I have made a huge number of blocks – two crates full! I want to invite people to arrange the blocks however they feel is good for them and to use them to gain insight into what the numbers are saying about the people passing through the asylum. There was very little to be done in the way of a ‘cure’ but rest and a plentiful and good diet probably helped quite a lot. Capable patients were given jobs helping out around the place. It was run as a community and had animals and market gardens where food was produced as well as a sewing room, laundry and kitchen where women were allowed to work. Both men and women helped out on the wards as well.
That so many people left in a comparatively short time suggests to me that the asylum did provide a genuine respite for patients from their very hard lives. The high number of deaths shortly after admission indicates very poor health at admission. GPI or general paralysis of the insane, what we now know as tertiary syphilis, was incurable before antibiotics which were not generally available until after the Second World War. Syphilitics would probably die within three years so I chose that as a threshold point.
This project is to be unveiled at the Glenside Hospital Museum for Bristol Doors Open day, Sunday 11 September 2016 so it will be interesting to see what comes out of visitors responses to these masses of blocks.
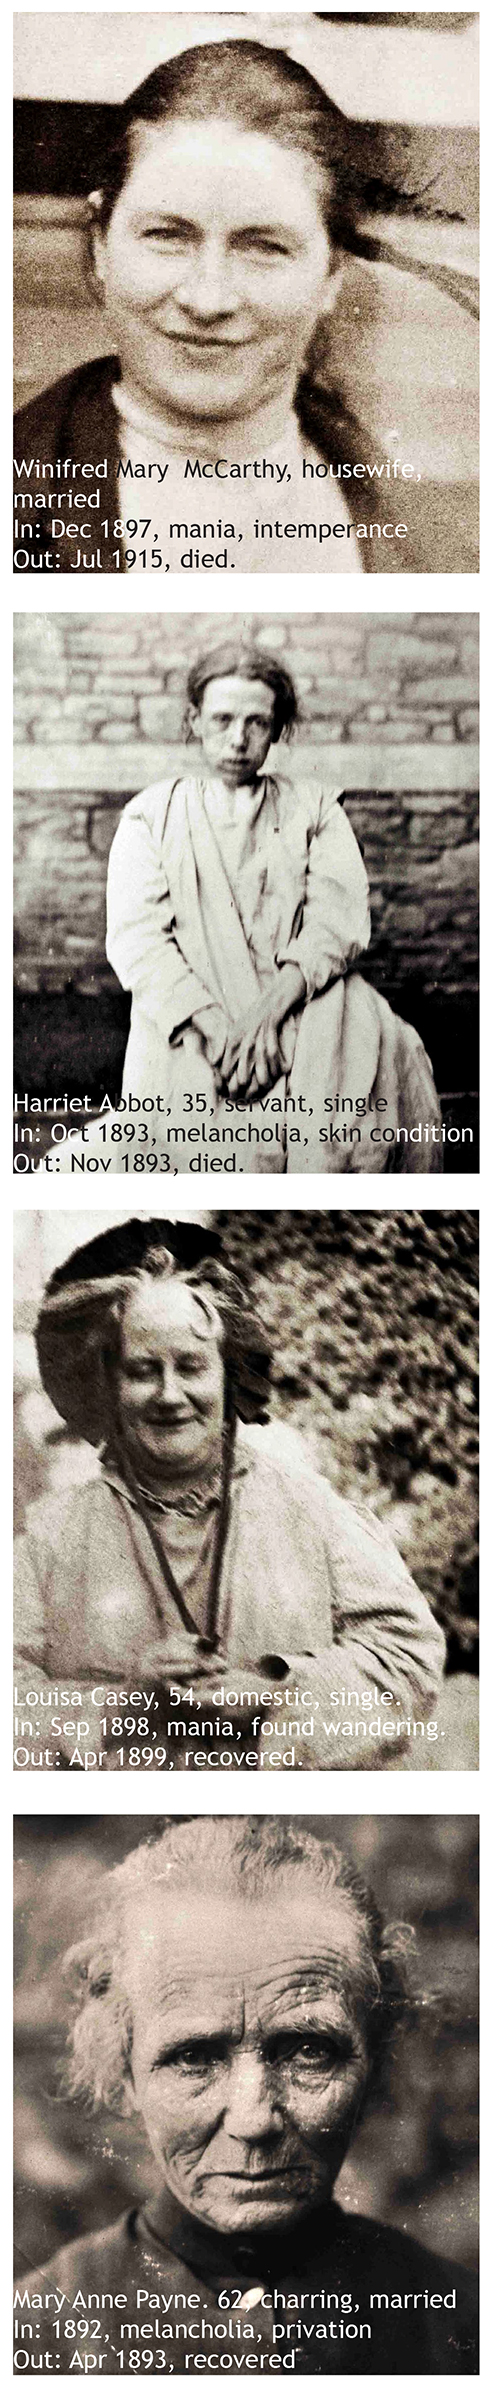
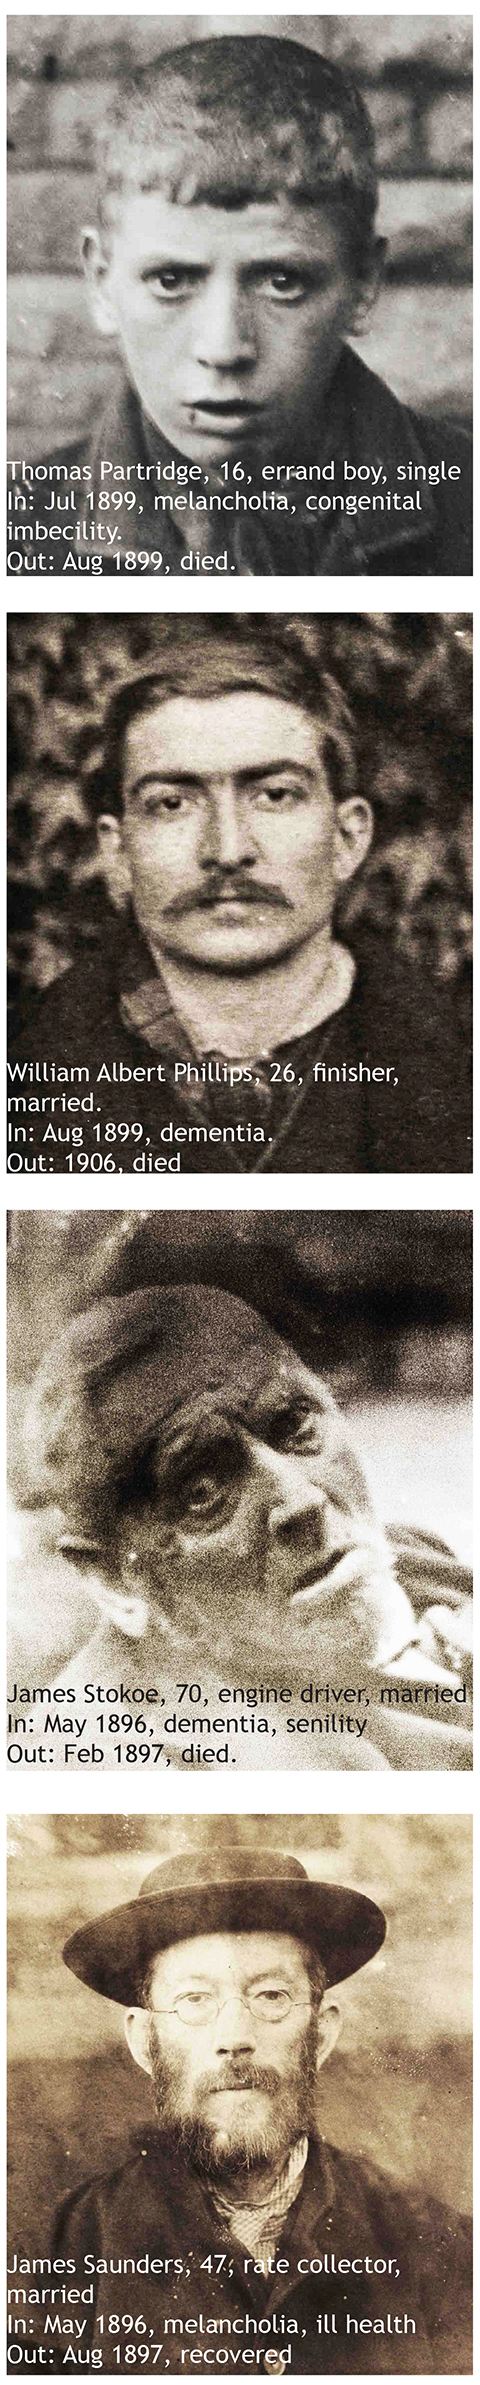
My interest in the patients came from looking at a wonderful spreadsheet of all the admissions to the hospital between 1861 when it opened and 1900, over 5000 of them. Starting in 1894 photos were taken of patients on admission and the records include around 700 portraits. Looking at these people and reading the spare notes on them in the spreadsheet is truly moving. They are people just like us. They were working people, their lives were hard, some were desperate.
Paul Tobia did this research at the Bristol Archive, he studied all the medical notes and tabulated the information. Some of the portraits he found are now displayed in the museum.
Four C19 women patientsFour C19 men patients
Many of the patients were in states of extreme ill health when they were admitted, up to half of them died within the year. There are a number messages from medical superintendents (Doctor in charge of the hospital) to Bristol City Council complaining that patients are being sent to them in such poor states of health that they are beyond help.
At this time there were limited diagnoses available to doctors; Mania, Dementia or Melancholia were the principal ones, with just a smattering of imbecility and occasional others. Paul Tobia noticed that the different medical superintendents favoured different diagnoses. The first one, Dr Stephens, did not believe in dementia and most patients were labeled as suffering from mania, whereas Dr Thompson, who took over in 1871, was more liable to diagnose dementia than mania.
We may think that Victorian women did not work but many of the women patients have occupations given, domestic servant is the most common occupation, but there are some more exotic jobs recorded; governess, sextoness, weaver, shoe binder, ex-bawdyhouse keeper. These are not wealthy people, the notes confirm their hard lives, they are recorded as suffering from ‘ill treatment by husband’, starvation, ill health, business worries, overwork, grief. A surprisingly large number are stated to have epilepsy, also noted are those with ‘General Paralysis of the Insane’ which today we know as Syphilis, at that time it wasn’t known that this was a sexually transmitted disease or that there was no cure for it. It is seen more frequently in men, they people died in the hospital and usually quite soon.
Analysing the data in the spread sheet has become my project. I have made various graphs from it and have been thinking as to how to express these data in a more physical and more interesting way. Excel graphs have their points but they are inclined to be dull and a bit uniform. I want to express some of the emotion attached to this data – these peoples lives.