Looking at my graphs and numbers I wanted to think how the humanity of the patients could be made more easily appreciated. Graphs are always a bit flat, and don’t convey so much if one is not used to thinking in those sorts of terms. But on the other hand how can one think about desperate people in such huge numbers. There are about 700 patient photographs all from the 1890s and looking through them is such a moving experience. Here are people who are just people who have somehow got to the point of needing serious help with getting on with their lives. We have no images of people admitted before about 1894.
I started thinking about bringing the graphs into the real world, tried piling up some lovely antique slate blocks I have (they had to be confiscated from actual children as they started throwing them round the room).
Then it occurred to me that if the blocks were coded somehow they would embody the graph and however they were arranged they would express what the graph was showing. So on to painted wooden blocks, with each block representing ten patients.
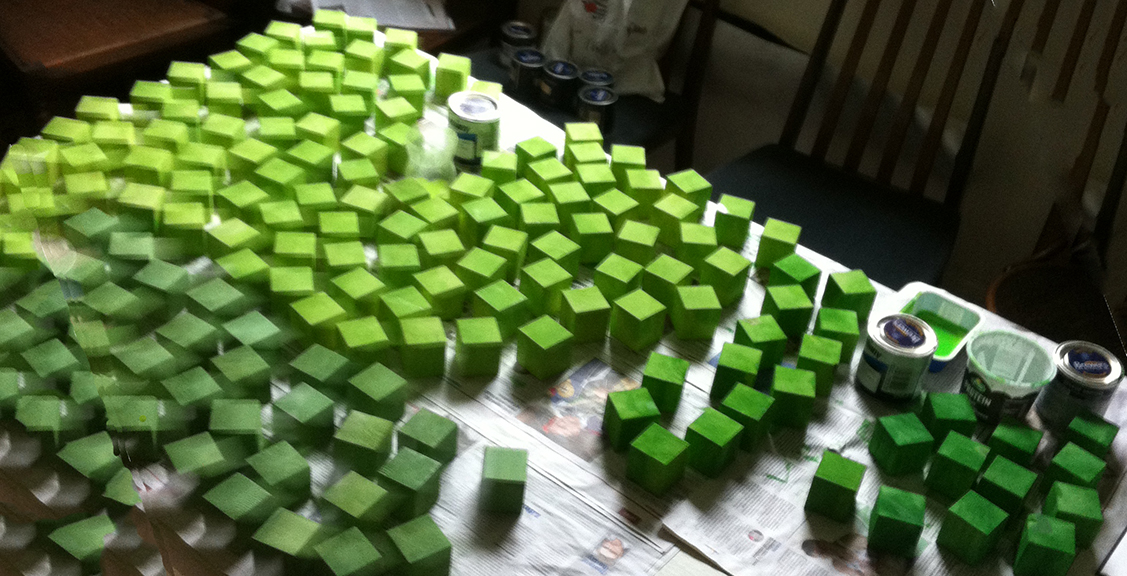
Green seemed like a nice, living colour so green is for patients who left, statedly recovered or relieved (their condition was improved), on their own two feet. The darker the colour the longer the stay. The blocks in the lower right corner are patients who left after more than ten years. A few people left who’s condition was said to be unchanged, others were transferred to another asylum, a few left with no outcome recorded and about eleven people (one woman and ten men) escaped at different times, these people are represented by plain, unpainted blocks. About half of the people admitted died in the asylum, these are represented by grey blocks which get darker for longer spent in the asylum, black for over ten years.
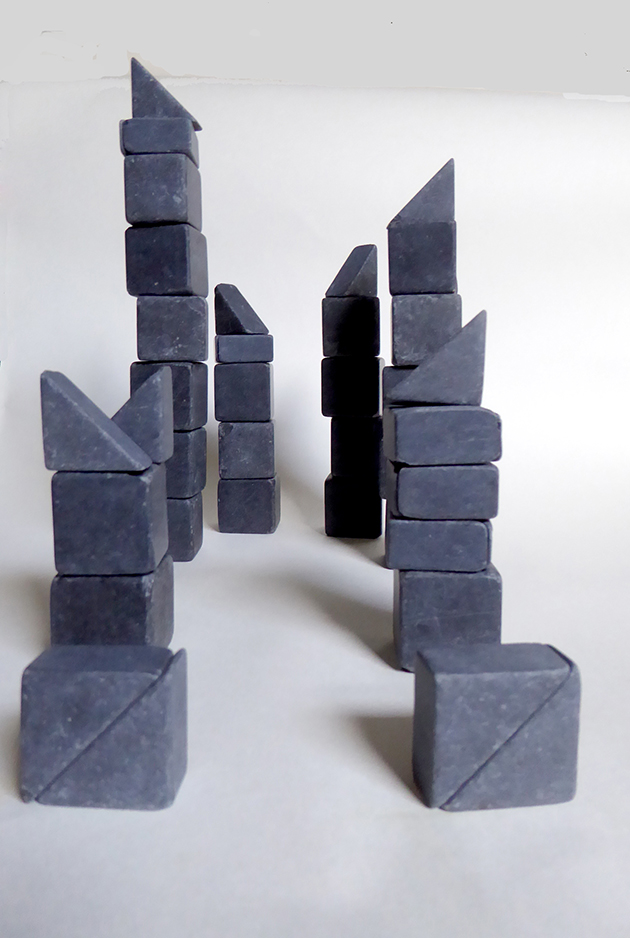
This photo shows people who were in the asylum for three months or less and people who died in the asylum within three months, within a year and within three years – three tones of grey.
The blocks show that about 70% of people who walked out did so within a year. Outcomes for men and women were different so I have marked the blocks with a gender.
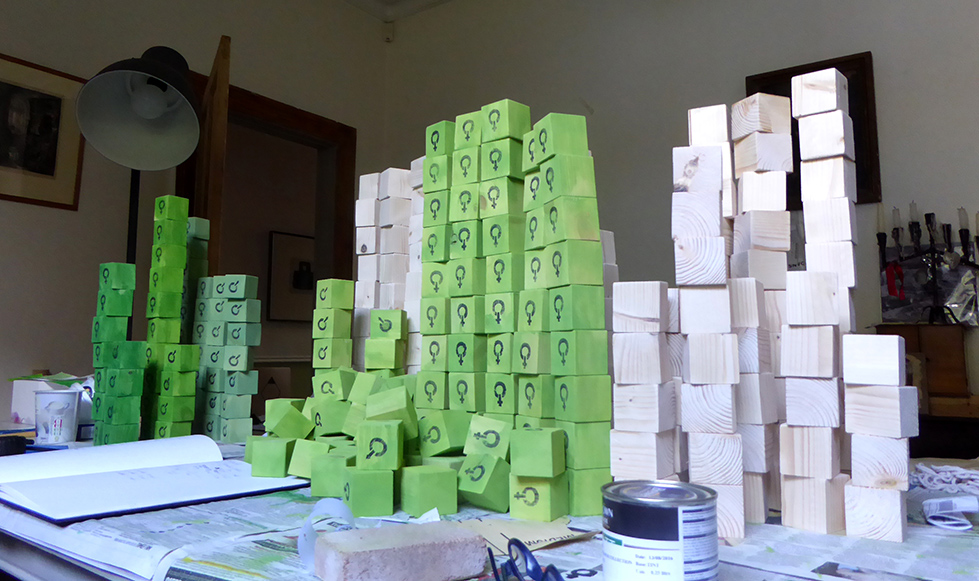
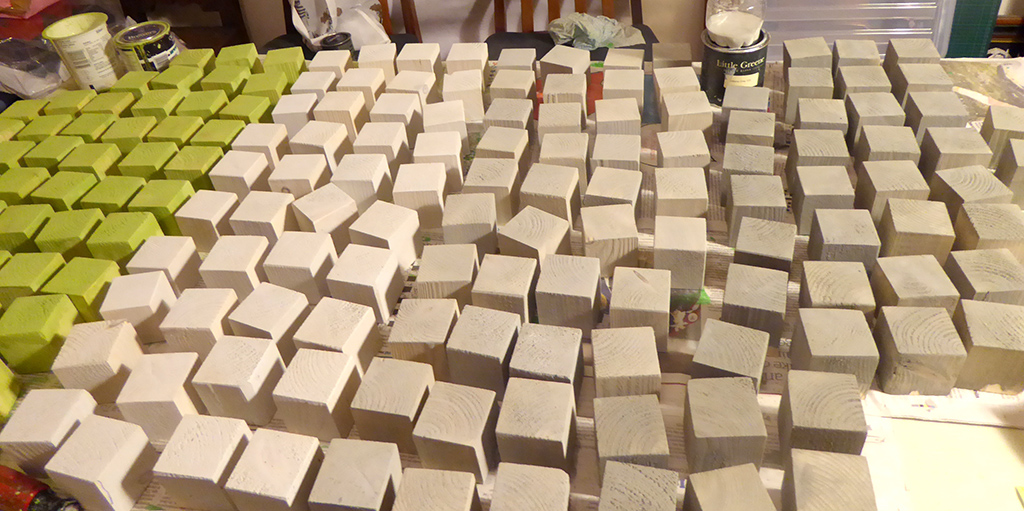
The blocks in the background are unpainted. The painted ones have been stencilled with a gender. There seem to be a lot of women, but the men have fallen over!
I have made a huge number of blocks – two crates full! I want to invite people to arrange the blocks however they feel is good for them and to use them to gain insight into what the numbers are saying about the people passing through the asylum. There was very little to be done in the way of a ‘cure’ but rest and a plentiful and good diet probably helped quite a lot. Capable patients were given jobs helping out around the place. It was run as a community and had animals and market gardens where food was produced as well as a sewing room, laundry and kitchen where women were allowed to work. Both men and women helped out on the wards as well.
That so many people left in a comparatively short time suggests to me that the asylum did provide a genuine respite for patients from their very hard lives. The high number of deaths shortly after admission indicates very poor health at admission. GPI or general paralysis of the insane, what we now know as tertiary syphilis, was incurable before antibiotics which were not generally available until after the Second World War. Syphilitics would probably die within three years so I chose that as a threshold point.
This project is to be unveiled at the Glenside Hospital Museum for Bristol Doors Open day, Sunday 11 September 2016 so it will be interesting to see what comes out of visitors responses to these masses of blocks.